The old-school way hides your numbers
The habit most of us were taught: when an estimate gets approved, print it to PDF and read it line by line to figure out what you are paying subcontractors and what the job really costs. That works, in the sense that it eventually produces an answer. It also eats hours and invites mistakes.
Xactimate will hand you the same data as a spreadsheet. Go into your token, then local, select the project, and on the right choose export to Excel instead of export to PDF. Everything after that is filtering, not reading.
One auto-sum, then filter your way to answers
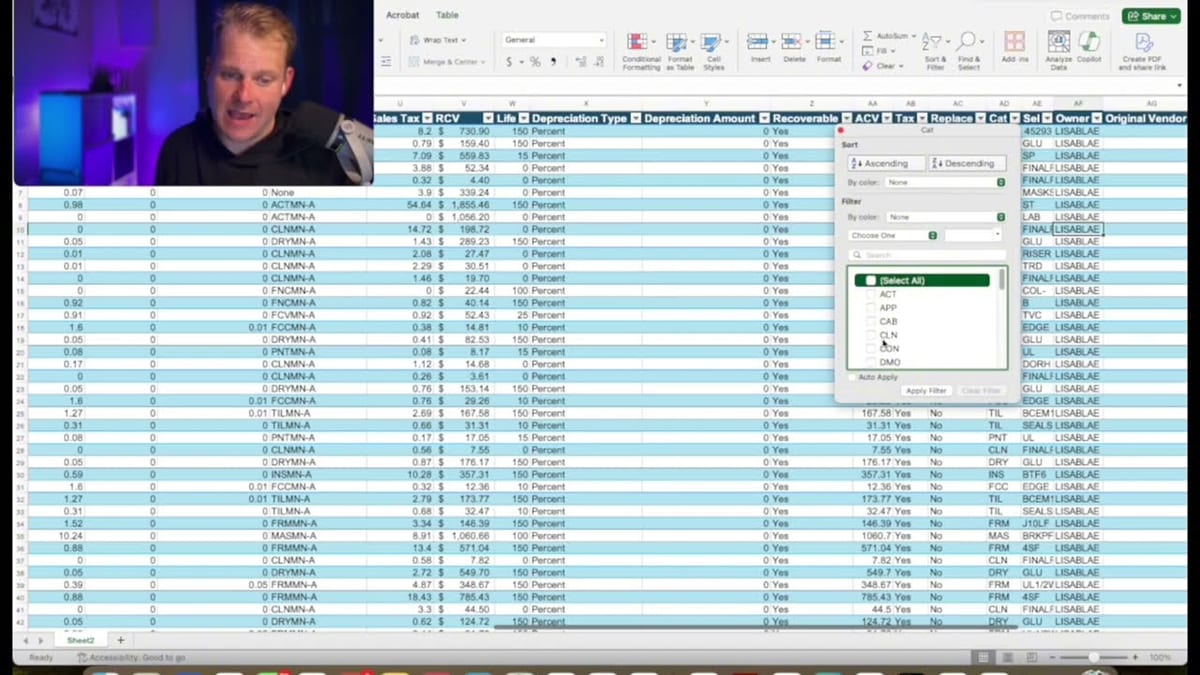
First move: highlight the RCV column, auto-sum it, and change the column type to accounting so it reads as dollars. That running total at the bottom now follows every filter you apply, which is the whole trick.
Need to know what the electrician gets paid? Filter the category column down to the electrical line items and read the total. In the example walked through in the video, that is about $1,000 to the subcontractor, and a clearer view of margin. Clear that filter, go to the group code or group description column, select only the bathroom, and now you know what that one room costs.
From there the built-in table tools can pivot the same data into ACV and RCV by room type, the same instinct that turns a $359-a-month compare tool into a five-minute build. You will format some columns yourself, but the insight is instant instead of hours of line-by-line reading. The switch from PDF to Excel saved the presenter several hours per week.
Read the columns before you trust the total
The export carries what the estimate carries, one row per line item: the category and selector that make up the code, the description, the quantity and its unit, unit price, RCV, depreciation, ACV, and the group or room the line belongs to. That last column is the one that makes room-level analysis possible at all, so a file written with everything dumped into a single folder will not produce room costs no matter how you filter it. Fix the structure in Xactimate and re-export; the spreadsheet cannot invent an organization the estimate never had.
The second thing to know before you act on a filtered number: a category filter sums the scope value of those lines, not the check you are about to write. Overhead and profit, sales tax, and minimum charges sit on the file rather than spread across every row, so the electrical total you just read is what the estimate says that work is worth, not what your sub will invoice. Compare the two on purpose — the gap is exactly the thing worth looking at — but do not treat them as the same number.
And when you want to know what the carrier has actually released, read ACV and depreciation rather than RCV. RCV is what the scope is worth once the work is finished; ACV is what gets paid now, and the difference comes back only after you complete the work and document it. A job that looks healthy on RCV and thin on ACV is a cash-flow problem, not a margin problem, and the two have completely different fixes.
Then let a model read the whole file
The video takes it one step further: paste the same exported estimate into ChatGPT and prompt it to act as a project manager. Ask for scheduling recommendations and job-level insights and it returns them immediately, sometimes surfacing things you would not have thought to check.
Treat that output the way you treat any junior analyst: useful for direction, verified before you act on it. The point is not that the model replaces your read of the job. The point is that your estimate data is only useful when it is in a form something can actually analyze, and a printed PDF is not that form.
Your estimate data is only useful in a form something can actually analyze.